Business Problem
An insurance company operates with an inflexible system where it is impossible to access client registration data categorized by sector of activity. Additionally, the system lacks field validation, which allows registration technicians to open client files in a non-standardized manner.
Solution
The fast and reliable technical solution consisted of uploading a .csv file containing the necessary classifications and normalizations. This file was used to feed and enrich the data available in the Data Lake through integration with the insurance company’s system.
The following workflow was established:
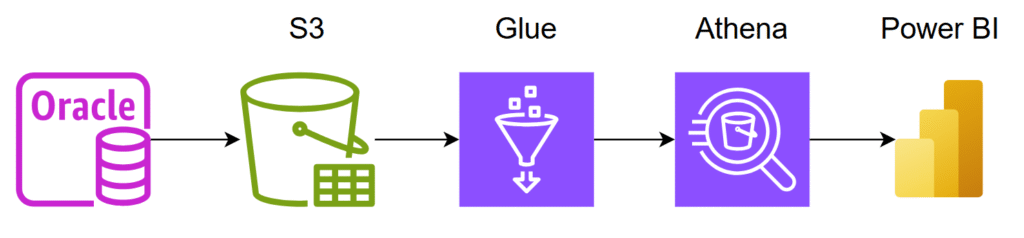
Img. 01 – Simplified Flowchart
The Oracle Database is connected to the Data Lake where the buckets were created. Within the datalake-autorizador bucket, the folder CENSUS_CLASSIFICACAO is created, where the apoio_census.csv file is uploaded.
S3://data-autorizador/CENSUS_CLASSIFICACAO/
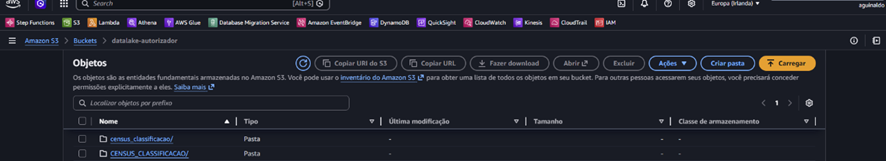
Img. 02 – Organizational folders S3 Bucket
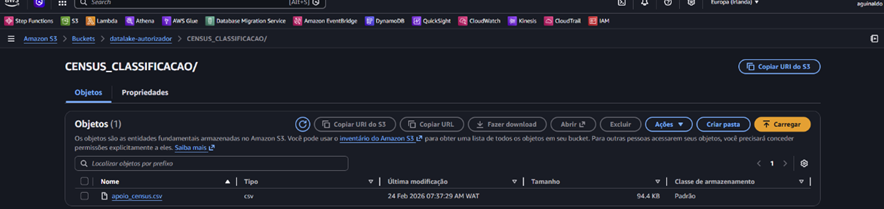
Img. 03 – Uploaded .csv file
Once the .csv file is uploaded, the Glue job is executed.
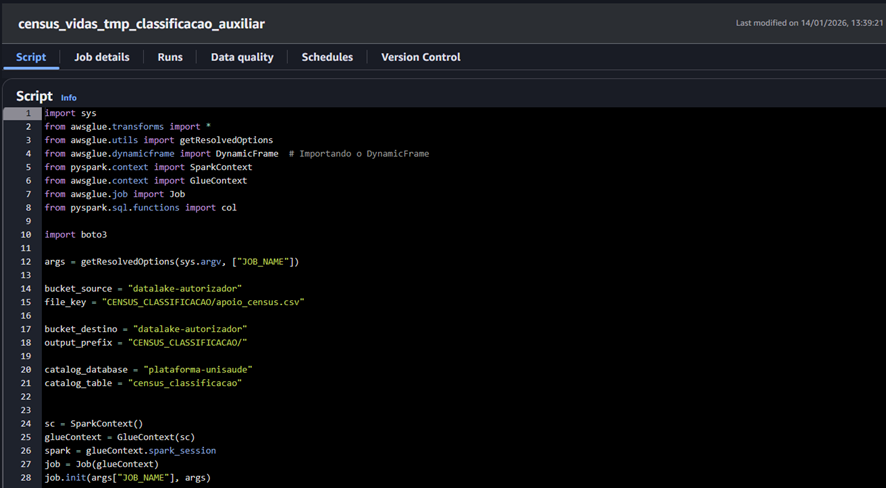
Img. 04 – Script of the job census_vidas_tmp_classificacao_auxiliar
This job creates the Parquet files, which are saved in the census_classificacao/ folder within S3.
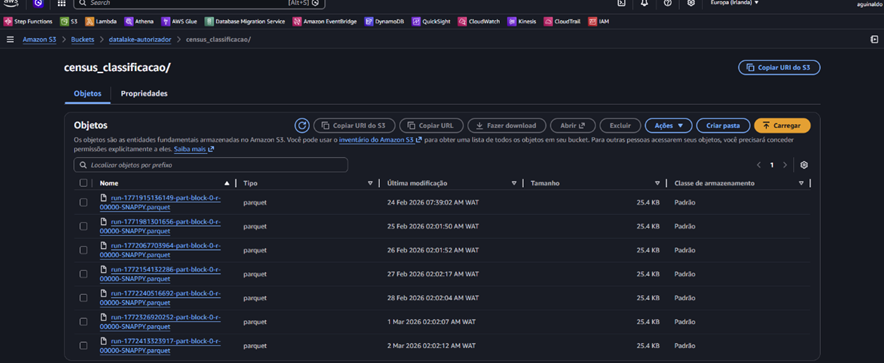
Img. 05 – Parquet files
Once the support table named census_classificacao is created , it is possible to write the query in Athena to enrich the data present in the view named vw_census_vidas_tmp.
SELECT
vw_census_vidas_tmp.apolice AS ID
,vw_census_vidas_tmp.empresa AS COMPANY
,vw_census_vidas_tmp.inicio_vigencia AS CONTRACT_START
,vw_census_vidas_tmp.fim_vigencia AS CONTRACT_END
--,COUNT (vw_census_vidas_tmp.exposicaohoje) AS Vidas
,census_classificacao.empresa AS REVIEWED_COMPANY
,census_classificacao.setoratividadeempresa AS SECTOR
,census_classificacao.tipocontrato AS CONTRACT_TYPE
FROM vw_census_vidas_tmp
LEFT JOIN census_classificacao ON vw_census_vidas_tmp.apolice = census_classificacao.apolicemit
WHERE
vw_census_vidas_tmp.situacao_beneficiario = 'Ativo' AND vw_census_vidas_tmp.situacao_da_apolice = 'Ativa'
GROUP BY
vw_census_vidas_tmp.apolice
,vw_census_vidas_tmp.empresa
,vw_census_vidas_tmp.inicio_vigencia
,vw_census_vidas_tmp.fim_vigencia
,census_classificacao.empresa
,census_classificacao.setoratividadeempresa
,census_classificacao.tipocontrato
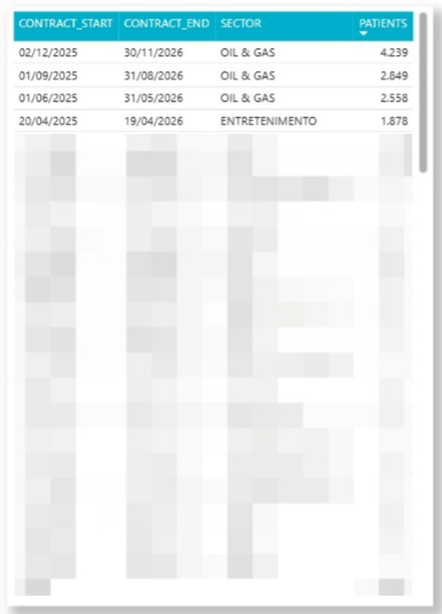
ORDER BY tipocontrato DESCBy creating a view from the query above, it is possible to connect the data to Power BI via ODBC and build visuals that are already normalized and enriched. For data privacy reasons, we will only present the central table extracted from the Power BI dashboard.
Conclusion
- Implemented a scalable data pipeline using AWS Glue for CSV to Parquet conversion.
- Achieved a 70% reduction in the volume of processed data.
- Structured optimized queries in Amazon Athena to serve as the foundation for management reports.
- Connected the AWS ecosystem to Power BI via ODBC, enabling real-time KPI visualization for strategic decision-making.